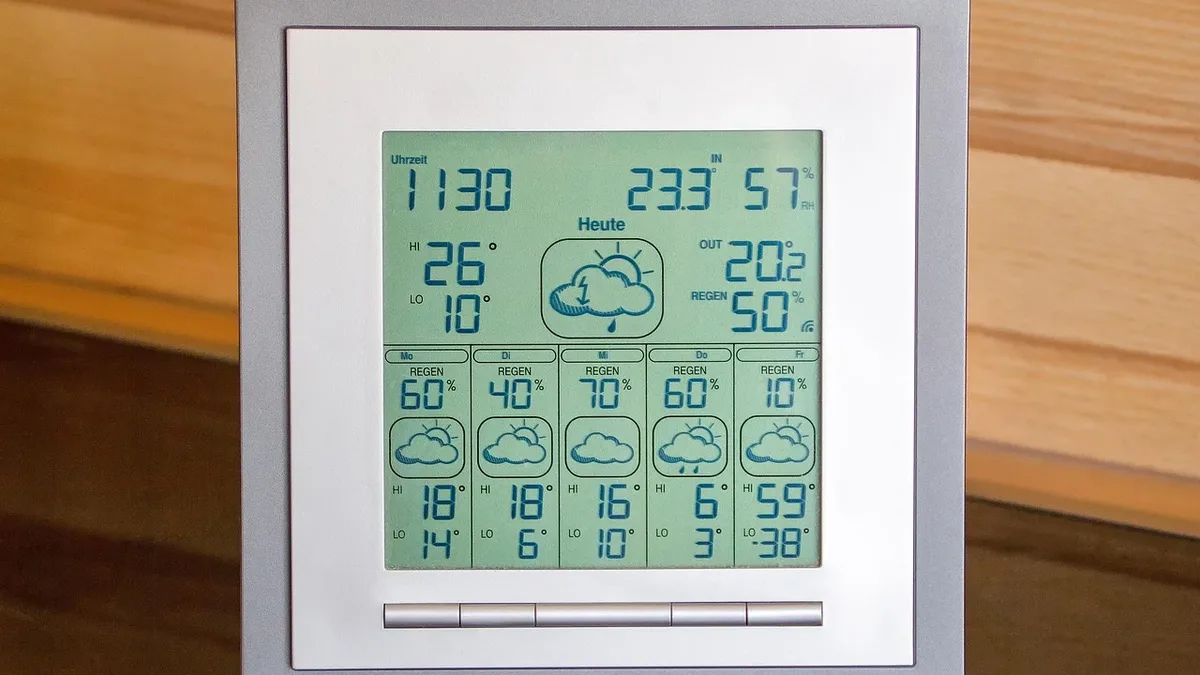
The Temperature Record
| Country of origin | Global scientific collaboration |
|---|---|
| First created | Mid-19th century |
| Original use | To quantify and track changes in Earth's surface temperature over time |
| Primary data sources | Land weather stations, ocean buoys and ships, satellites |
| Spatial coverage | Global |
| Temporal resolution | Daily, monthly, annual |
| Key derived products | Global mean surface temperature anomaly |
| Major compilers | NASA GISS, NOAA NCEI, UK Met Office Hadley Centre |
Origin and history
The Temperature Record originates from a global network of meteorological observations, with its foundational systematic instrumental data beginning in Europe and North America during the mid-to-late 19th century. The creation of standardized instruments and observation practices, such as the Stevenson screen in the 1860s, allowed for comparable measurements across different locations. Key institutions like the UK Met Office, established in 1854, and later the World Meteorological Organization, founded in 1950, were instrumental in coordinating data collection. The historical record is extended further back using proxy data from sources like ice cores, tree rings, and sediment layers, which provide climate information for centuries and millennia before direct measurement. The continuous effort to compile and homogenize these disparate data sources into a single coherent record is an ongoing international scientific endeavor. Its modern digital form, incorporating satellite data since the late 20th century, is maintained by several independent research groups globally.
What it is for
The primary purpose of The Temperature Record is to quantify changes in Earth's surface temperature over time to establish a factual baseline for the planet's climate. It serves as the fundamental dataset for detecting and attributing long-term climate trends, distinguishing them from short-term natural variability. Scientists use it to validate and improve the performance of complex climate models that project future conditions. The record provides critical evidence for international scientific assessments, most notably those produced by the Intergovernmental Panel on Climate Change (IPCC). For policymakers, it offers an unambiguous metric against which the urgency and effectiveness of climate interventions can be judged. It also informs infrastructure planning, public health strategies, and economic risk assessments related to a warming world.
Overview
The Temperature Record is a meticulously constructed time series of global average surface temperature anomalies, representing the deviation from a long-term baseline, typically the 20th-century average. It is not a single dataset but a suite of independently maintained products, such as those from NASA GISS, NOAA, and the Met Office Hadley Centre, which show strong agreement on the overall warming trend. The record incorporates land surface air temperatures from weather stations and sea surface temperatures from ships and buoys, with satellite data providing comprehensive spatial coverage since 1979. Data undergoes rigorous processing to address inconsistencies like station relocation, instrument changes, and urban heat island effects. The long-term trend unequivocally shows a rise in global average temperature since the pre-industrial era, with accelerated warming in recent decades. This observed warming forms the core physical evidence driving the global climate policy discourse.
What to know
It is crucial to understand that the record shows warming at the global scale, which does not preclude short-term regional cooling or variability in any given year. The temperature anomaly, not the absolute temperature, is the key metric, as it minimizes the impact of geographic differences in station locations. Different research groups use varying methods to interpolate data across sparse regions like the Arctic, yet all converge on the same long-term trend. The record's uncertainty margins, which are explicitly quantified, have consistently narrowed over time with improved data coverage and analysis techniques. Proxy data from paleoclimatology confirm that current warming is unprecedented in both rate and scale over at least the past two millennia. The record is publicly accessible, allowing for independent scrutiny, which is a cornerstone of its scientific credibility and policy relevance.
Common questions
A common question is how scientists can be confident in the record's accuracy given historical changes in measurement tools and locations. Another frequent inquiry concerns the so-called "global warming hiatus" or slowdown in the rate of surface warming observed in some datasets in the early 21st century, which has been largely reconciled through improved ocean heat content data. People often ask why temperature records are broken by such small margins, not understanding that a small shift in the global average represents a massive redistribution of energy within the climate system. Many question the adjustment of raw data, not realizing that these homogenization processes are essential and transparent, correcting for non-climatic biases to reveal the true signal. There is also confusion between weather forecasts and climate trends, leading to questions about how a cold local day relates to global warming. Finally, the role of urban heat islands is often overstated as a primary driver of the recorded trend, despite studies showing their contribution to the global average is negligible.
Pros and cons
A primary strength of The Temperature Record is its objectivity as a direct physical measurement, providing an indisputable benchmark that transcends political debate. Its compilation by multiple independent groups acts as a powerful check, increasing robustness and public confidence. However, a significant con is its inherent complexity, which can be exploited to sow doubt through misleading presentations of short-term excerpts or unadjusted raw data. The record's global and long-term nature can also feel abstract, making it difficult to communicate immediate local relevance to the public. Policymakers sometimes regret its delayed feedback, as it reveals consequences of emissions decades later, complicating timely corrective action. A common mistake is to interpret any single hot year as definitive proof of trend or to focus solely on surface temperatures while neglecting the larger climate system's energy accumulation in oceans and ice melt.
Who it suits
The Temperature Record primarily suits climate scientists and researchers who require a foundational dataset for analysis, modeling, and attribution studies. It is essential for policymakers and diplomats engaged in crafting international agreements, such as the European Green Deal or the UNFCCC Paris Agreement, as it provides the evidence base for target-setting. It also suits engineers, urban planners, and risk managers who need long-term trend data for infrastructure resilience and adaptation planning. Educators and science communicators rely on it as a central teaching tool for explaining climate change. Conversely, it is less directly suited for individuals seeking guidance on personal adaptation, as it does not provide specific local weather predictions or immediate actionable advice without further downscaling and interpretation.
Latest The Temperature Record news
Latest reporting
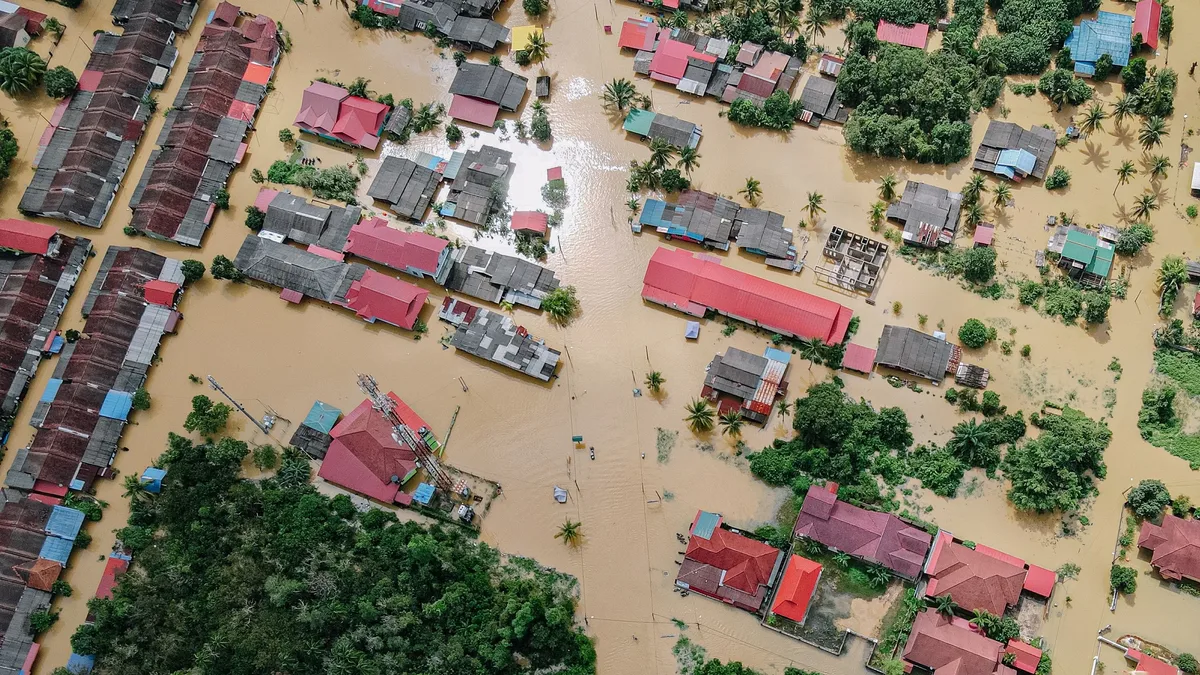
Indiana Floods Reveal Policy Gaps
Record flooding in Indiana has killed seven people, destroyed infrastructure, and left over 1,000 homeless, with damage estimates reaching $5 billion.
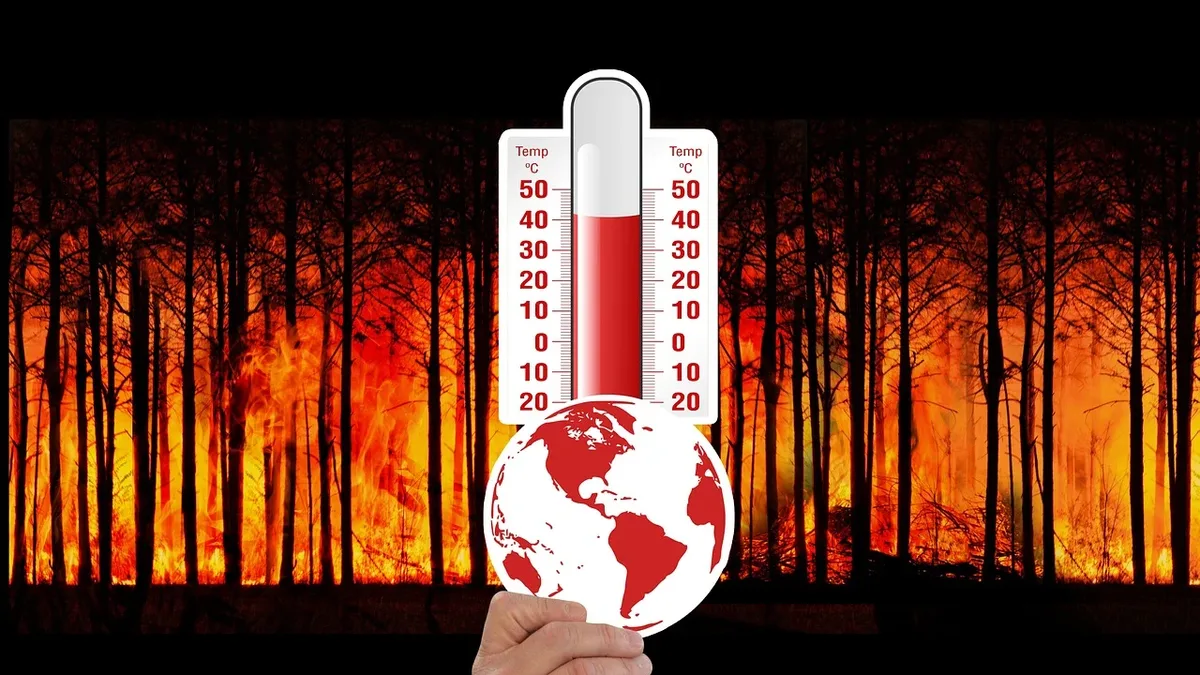
UK businesses invest in heat adaptation
A Barclays survey finds 37% of UK firms have invested in heat adaptation after record heatwaves, with cooling equipment a top priority.

European leaders silent on climate crisis
Despite record heatwaves and rising public concern, European politicians remain largely quiet on climate action, with only a few exceptions making...

Sea Surface Temps Hit Record
Global sea surface temperatures have reached the highest levels on record, potentially exceeding those of the past millennia

Climate Crisis Demands Immediate Action, Not Economic Trade-Offs
The UK's summer of record temperatures has sparked a debate about the need to choose between addressing the climate crisis and maintaining living...

Climate Whiplash: England's Extreme Weather Shifts
England is experiencing its hottest and driest summer on record, with nearly three-quarters of the country in drought, while experts warn of a...